Software Blue Control


Product detailed description
BlueControl
The primary function of the software is to create, download and save device configurations and profiles. Depending on the device, other functions may be possible, such as changes to the device function; adding additional screens to the operating mode, changing the function of the displays or LEDs, or changing the contact information or splash screen. The software can also be used to download a new language file if this feature is available.
An on-screen instrument simulation can be set up and tested on a configurable load simulator to test the configuration file before downloading to a live instrument.
Starting BlueControl
When you start the BlueControl software, you will have several options:

Open Existing Project - This allows you to browse for an existing .bct file to be loaded into the application BlueControl.
Open Last Project - Opens the last saved .bct file.
Create New Project - This allows you to select a device and its options and presents you with a default configuration.
The .bct (configuration file) files contain all the information about the device, including optional modules and all parameter settings.
Creating a new project
When creating a new project, the following screen will appear. Here the device type and its optional modules should be selected to match the target device. These options can be selected from drop-down lists or by entering the full model number into the Order Number field, it will automatically select the appropriate options.
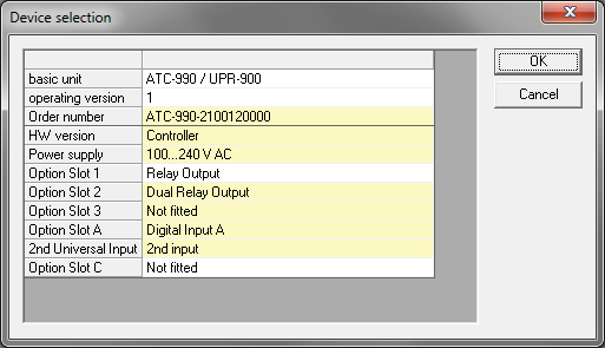 Ideally, the options on this device selection screen should match the options on the target device to download to .
Alternatively, the entire device type and existing configuration can be uploaded to the computer from your device, via the configuration socket or, if possible, via serial communication. This process is explained in Connecting to a Device.
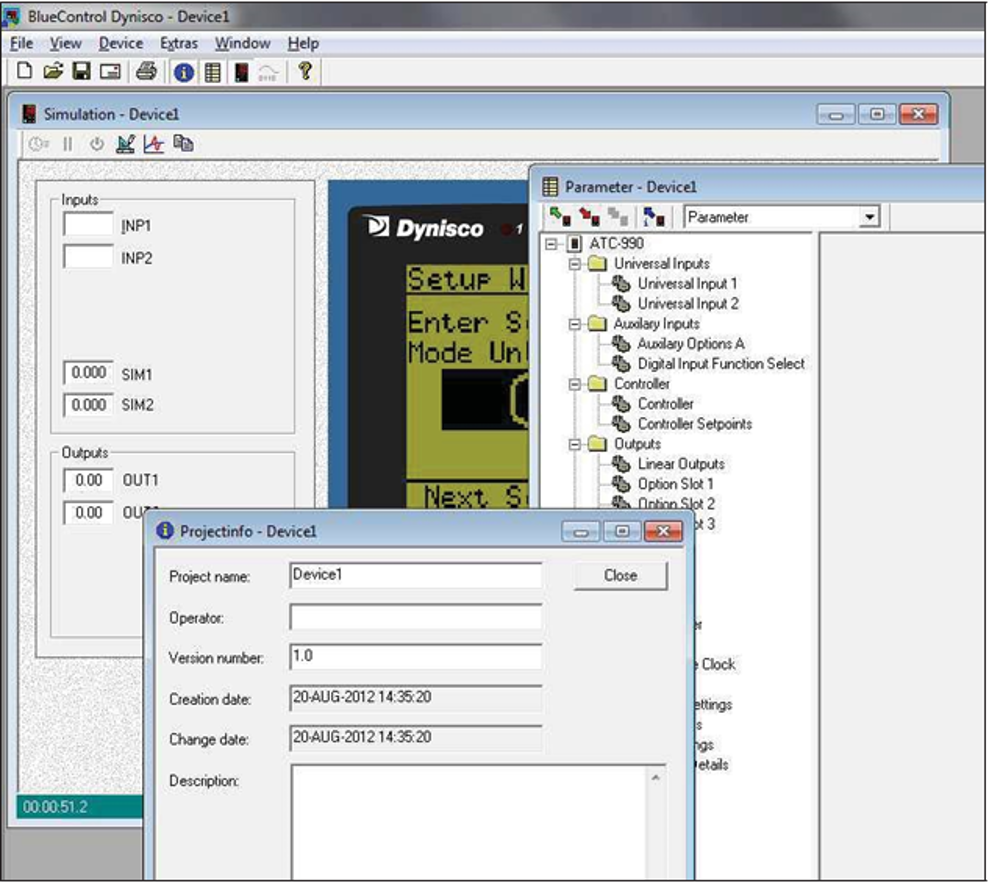
BlueControl Workspace
Usually when you start a new project it will have a workspace three child windows.
- Project Info - This window allows you to enter custom information that helps describe / identify the current configuration project. This information is not downloaded to the device.
- Simulation - This window will run a simulated version of the selected device. It was designed to run as much firmware code as possible in the Windows environment. This means that changes to parameters etc. can be saved to this simulation and tested before being deployed to a physical device. For information on connecting to the simulation to upload / download parameters, see the "Connection Configuration" section.
- Parameter - This window is used to monitor and modify all device parameters. Each parameter is categorized in a tree structure on the left for easy navigation, and is usually displayed either as a drop-down list of available properties or has a valid ranges label on the right. See "Configuring Parameters" for details.
 |
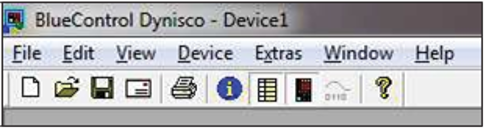
Workspace toolbar
 |
 |
The parameter screen contains all device settings (parameters) divided into functional groups. The parameters can be changed in the yellow column Value. Enter a new value or select from the list provided as needed. The possible range of values is shown on the right. If an invalid value is entered, it will be highlighted in red. Parameters are "greyed out" if they are currently unavailable due to hardware not being installed or if they are disabled by other settings.
Parameters window Panel tools
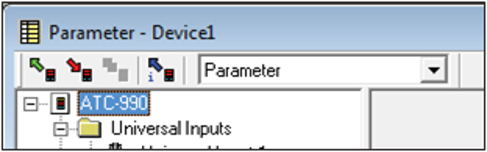 |
Description of buttons toolbar from left to right:
- Get data from device - Connects to device and gets all parameter settings.
- Save data to device - Connects to device and sets all parameters.
- Device Connection - Not supported in this version.
- Device Information - Connects to a device, gets information and displays it.
- Mode (dropdown list ) - Various ways to display parameter information.
Simulation window
The simulation window allows the user to upload and download configurations to it and test them before deployment in real units. When using the simulation, screen navigation and parameter changes can be done either by using the virtual keys on the simulation by clicking on them with the mouse pointer, or by pressing the keys associated with the keyboard. The keys you use are usually the cursor keys, however to make this work you need to make sure the front panel of the simulation has focus by clicking on it with the mouse pointer before using the keyboard keys.
To the left of the simulation is an input/output panel. This allows the user to change any input values that the unit provides, such as PV, Digital Inputs, etc. This panel also displays the states or values of the units' outputs.
The Simulation and Inputs/Outputs panel will only display the options appropriate to the device type (including optional modules) that are selected in the Device> Select Device window. This combination of a simulated front panel and visible displays of inputs and outputs gives a good understanding of how the unit will work.
Simulation Toolbar
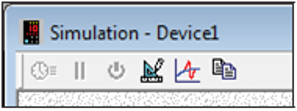 |
Description of toolbar buttons from left to right:
- Turbo - Not supported in this version
- Pause - not supported in this version
- Power On / Off - not supported in this version
- Process Parameters - Settings for the simulated process. Changes how it reacts.
- Fault - Allows you to introduce a fault into the simulated process.
- Copy Screen - takes a screenshot of the simulation HMI and saves it to the clipboard.
Device connection

The software can communicate with the device via the configuration socket located on the device, or via the Modbus TCP or RS485 communication interface, if available available.
The configuration socket is intended for the initial configuration of the device before installation into the application. An RS232 or USB to TTL cable (available from your supplier) is required to connect from a PC to this socket. A front USB port is available on some models. this can also be used to configure the device or transfer profile files via a USB memory stick.
When you try to connect to the device from the software, the communication settings screen will appear. In order for communication to work successfully, the settings must be correct.
When connecting to simulation (to allow recording or downloading of configurations or to obtain information about the recorder), the PC connector must be set to simulation.
Change splash screen
Some tools display graphics during the startup sequence. This can be changed from the main parameters screen. From the Device menu, select Download splash screen.
Most common graphic file types are supported for sending the splash screen, and the selected image is resized to fit the device's display. Complex graphics with multiple colors or shades of gray will not reproduce well. A preview of the results will appear. Click the Download button and save it to your device.
For best results, the image should be simple and have the same aspect ratio as the display. Ideally, it should be 160 x 80 pixels and saved as a monochrome bitmap file.
Changing the alternate display language
If alternate languages are supported, they can be changed from the main parameters screen. From the Devices menu, select Download Language File. Select the correct file (language files have a .bin or .bdl extension) and click Open to save it to the tool.
Trend view display
BlueControl provides the ability to view all recorded data (in devices equipped with a recorder module) as a trend display for visual representation. The data can then be better analyzed using functions such as zoom and cursor reading.
Getting Trend Display Data
In order to create a trend display, the recorder recording must first be read from the unit. Use the following method:
- From the Workspace menu, select Device> Retrieve logger data from device.
- Enter the file name where the received data should be saved and click Save
- Then select the appropriate communication settings for the connected unit and click OK.
- Data will start downloading from the unit to the computer. Depending on how much data was recorded, this may take several minutes.
 |
Once the download is complete; click File> Open Trend and select the CVS file that was saved in the previous step.
Trend View Toolbar
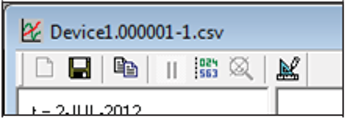 |
Description of panel buttons tools from left to right:
- Reset - Not supported in this version.
- Save trend - Saves a CVS data file.
- Copy - Takes a scan of the trend view and saves to clipboard.
- Pause - not supported in this version.
- Cursor - used to measure each trend at a given point.
- No Zoom - Used to return to view after zooming in.
- Settings - Displays the settings window. Described below.
Zoom in
This is simply done by clicking and dragging the mouse over the area you want to zoom in on. This can be repeated several times to further enlarge the data. To return to full view, click the No Zoom button in the toolbar.
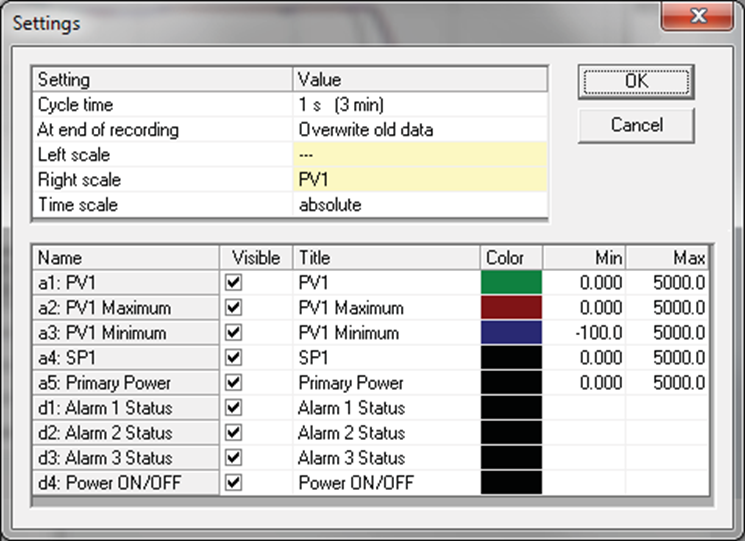
Settings Window - Trend View
Settings Window allows the user to toggle which data is displayed and the scale of those data items. If the trend display disappears from the top of the visible area, try increasing the value in the Max column of this window.
 |
Providing Innovative Solutions
For more than 60 years, with a commitment to helping customers, Dynisco has been providing tools and services for the polymer industry that offer its customers a 'window into the process' - an insight into the manufacturing process.
Today's customers need accurate information that allows them to verify and, if necessary, adjust their process to ensure that their products meet precise specifications. The information provided by Dynisco enables our customers to maintain a consistent process regardless of their global location.
Dynisco's portfolio represents a vast array of sensors (transducers), evaluation and display technology along with laboratory instruments with the possibility of online connection directly in production, thus providing you with the most accurate information about your production process in the market, in the field of measuring rheological properties of polymers, pressure, and temperature.
Dynisco provides our customers with the ability to compare data obtained from a pilot project with a laboratory environment with online production 24 hours a day. This data allows for immediate response and system adjustment in critical situations, ensuring that any deviations are immediately corrected to guarantee maximum quality at maximum performance.

History of Dynisco
Dynisco, known worldwide for top-notch products in pressure and temperature measurement and regulation for the plastic extrusion industry, has been developing innovative and high-quality solutions for plastic extrusion processing for 60 years and is founded on the expertise of engineers with an average of 15-20 years of experience. Dynisco's sensors, controls, and analytical instruments have proven to offer better control, reduce downtime, minimal scrap, and unmatched reliability and working life. Our commitment and ability to collaborate with you to help you measure, analyze, and equip extrusion control systems that meet your precise needs are unparalleled. From breakthrough technology in the most comprehensive range of sensors to renowned quality and performance in indicators, controls, and analytical tools.
Dynisco Sensors Dynisco was designed specifically for the robust environment of the plastics industry and has developed some of the most advanced solutions for measuring plastic extrusion, molding, and control applications. We produce a wide range of robust melt pressure sensors compatible with mV/V, mA, VDC, and HART thanks to engineering excellence based on expertise and experience.
Dynisco Analytical Instruments The quality of the process begins with the use of material. Dynisco's analytical tools enable the processor to verify material specification and optimize process conditions. These tools include flow Dynisco Heilbronn Facility in Germany
melt indexers, capillary rheometers, and small laboratory mixing extrusion systems. Dynisco also offers the most comprehensive and accurate range of on-line rheometers available on the market.
Dynisco offers a complete range of global services and technical support for our complete line. Dozens of highly qualified technical support workers are deployed internationally and provide:
Expert consultations Custom solution design On-site equipment diagnostics and troubleshooting Repairs and maintenance of transducers ∙ Installation services Equipment operation training ∙ System repairs, spare parts, preventive maintenance, and more
Customers from around the world have discovered that Dynisco is dedicated to product innovation and advanced system solutions that significantly impact the efficiency of manufacturing processes.